Relative Brain Size Of Males Vs. Female Scarlet Shiners
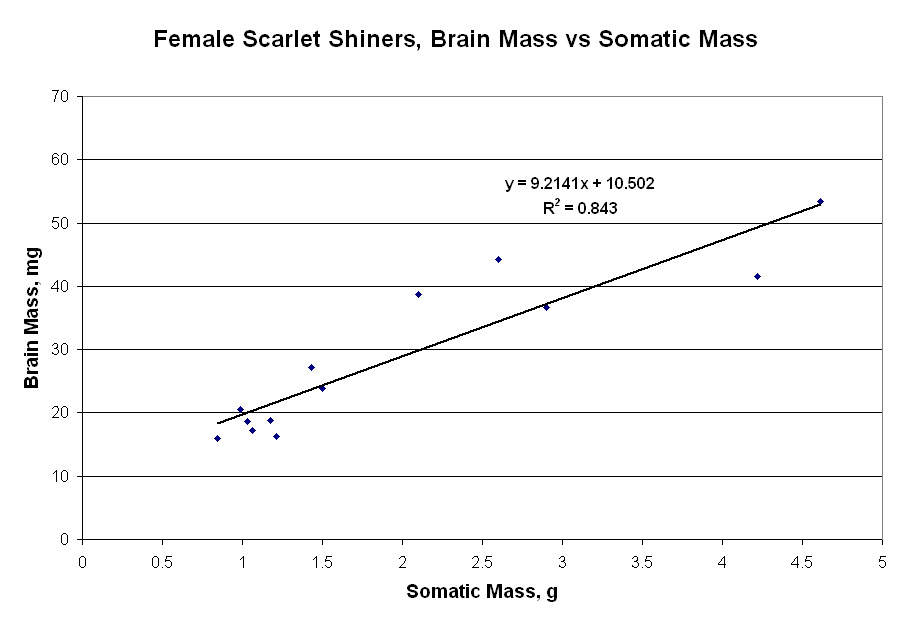
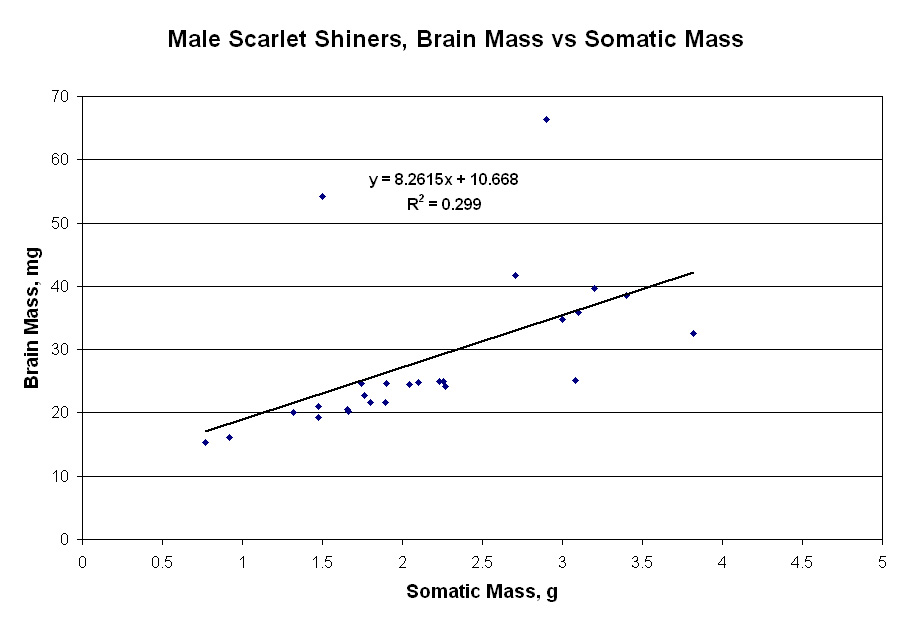
We have our initial data from examining the relationship between brain mass and somatic (body) mass in scarlet shiners, Lythrurus fasciolaris. This is based on examining 13 females and 27 males. Pooling all the data together yielded a reasonably tight relationship between brain mass and somatic mass. But there were some interesting outliers in the data set, lying fairly far off the regression line. So I separated the data into female and male sets and constructed graphs for each, including regression lines (surprisingly easy in Excel). The graphs are below. In short, they show that there's much less variation in brain size among females than among males. All of the data outliers are for male fish. A measure of this variation is the regression coefficient, R-squared, which varies between 0 and 1. A high value shows a tight relationship between the variables, a low value a weaker relationship. The females' have a high R-squared of 0.84, the males have a much weaker R-squared of 0.3. One would expect males to have more variation in such an important bundle of traits as brain size, since males have a much wider variation in reproductive success that's influenced by brain structures and functions. (Remember, if you click on the graph it will expand in a new window.)
posted by Bruce Stallsmith @ 5:28 PM
0 comments
![]()

0 Comments:
Post a Comment
<< Home